IIRA Skincare: 2.3x Repeat Customer
with Zero Ad Spend.
How we turned discount-dependent revenue into predictable, repeat-driven growth "without spending a dollar more on acquisition."
Zero incremental ad spend — we optimized existing customer revenue instead of buying new ones.
About IIRA — a skincare brand backed by science, made for every skin, every story.
"We were trapped in the discount cycle. You guys (Reimagine Studio) helped us see 60% of our repeat customers were already there — we just weren't talking to them."
Discount dependency was eating 11 months of revenue.
IIRA faced a challenge that affects 70% of D2C skincare brands: discount dependency. Most of their annual revenue arrived in a single month, "November Black Friday"
The remaining 11 months were financially dead. Repeat purchase rate hovered around 20–25%, meaning 75% of hard-won customers never came back.
Growing meant increasing ad spend just to replace lost customers. An unsustainable treadmill.
They weren't ignoring acquisition.
They were ignoring the customers they already had.
Offers blurred together — the only lever left was price. We redesigned the ad creative and offer architecture so the brand sold on value, not just discount.
Customers bought once and disappeared. There was no system bringing them back. We installed an email marketing engine to nurture, segment, and re-activate.
Three layers of Revenue Flow Architecture.
Weekly Community-First Email Nurture
A weekly sequence designed to keep IIRA in customers' minds during off-season months. Brand story, customer wins, skincare education, founder insights. Soft product mentions — never a hard push.
Customers don't forget brands that consistently add value. We rebuilt the relationship layer that BFCM selling depends on.
Engagement Segmentation
We separated the engaged segment (opened 3+ emails in 60 days, clicked products, recently purchased) — ~35–40% of the list but responsible for 70%+ of repeat revenue potential.
Segmentation gave us confidence to go aggressive with VIPs without risking unsubscribes from passive customers.
Exclusive BFCM Campaign
Engaged customers got 48-hour early access, exclusive bundles, and personal founder messaging. Passive customers got a reactivation sequence. The general list got the standard offer.
Engaged customers bought bundles (higher AOV), came back more often, and generated 60%+ of total BFCM revenue.
How the money actually moves now.
From $2K to $6K revenue in 14 days.
300% growth. Zero new ad spend.
Results from BFCM 2025 (Nov–Dec 2025), executed with an 8-week lead time starting September 2025.
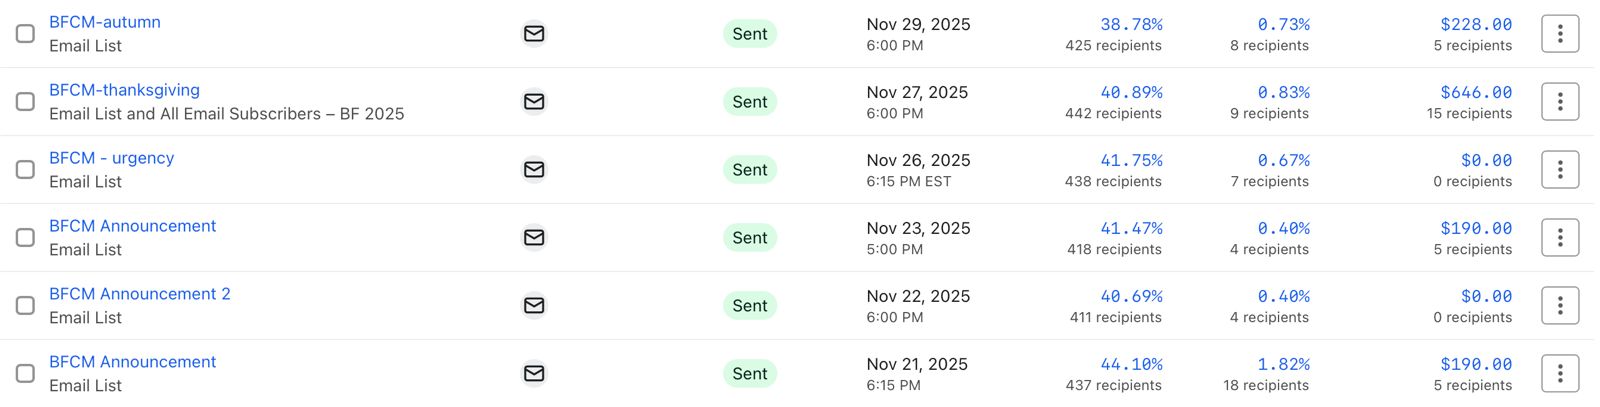
Six emails over nine days — 40%+ average open rates and four figures of attributable revenue from a list we'd been nurturing all year. No new ad spend.For context: 28–32% open rate on engaged segments vs. industry average of 18–22%.
| Metric | Before | After | Change |
|---|---|---|---|
| Monthly Revenue | $2,000 | $6,000 | +3× |
| Monthly Profit | $500 | $1,500 | +3% margin |
| 2-Month Revenue | $4,000 | $10,000 | +$6,000 |
| Repeat Purchase Rate | 20–25% | 55–60% | +2.3× |
| Email Open Rate | 15–18% | 28–32% | +70% |
| Revenue from Repeat Customers | 20% | 60% | +3× |
| Incremental Ad Spend | Baseline | +$0 | $0 |
Run the same play in 8 weeks.
- % of customers who purchased more than once
- Current repeat rate
- Off-season email cadence
- Average customer LTV
- Founder story / brand origin
- Customer win / testimonial
- Educational (how-to, ingredients)
- Soft product mention
- Engaged: 48-hr early access + bundles
- Passive: reactivation sequence
- Track AOV, repeat, LTV by segment
Timeline: 4 weeks to launch · 8 weeks to results · Investment: time + platform costs. No additional ad spend needed.
| IIRA provided | Reimagine provided |
|---|---|
| Product intel | Strategy |
| Email platform access | Email copy |
| Customer data | Segmentation setup |
| — | Testing & optimization |
IIRA didn't invent a new product.
They didn't launch a viral campaign.
They didn't run expensive new ads.
“They simply stopped ignoring their existing customers.
Revenue Flow Architecture™ isn't about finding new customers. It's about unlocking revenue from the customers you already have.
Take the playbook with you.
Save the full case study and subscribe for more breakdowns like this.
Revenue Flow Architecture™
A repeatable framework for D2C brands ready to stop renting revenue from one peak event — and start owning it year-round.
reimaginestudio.in →